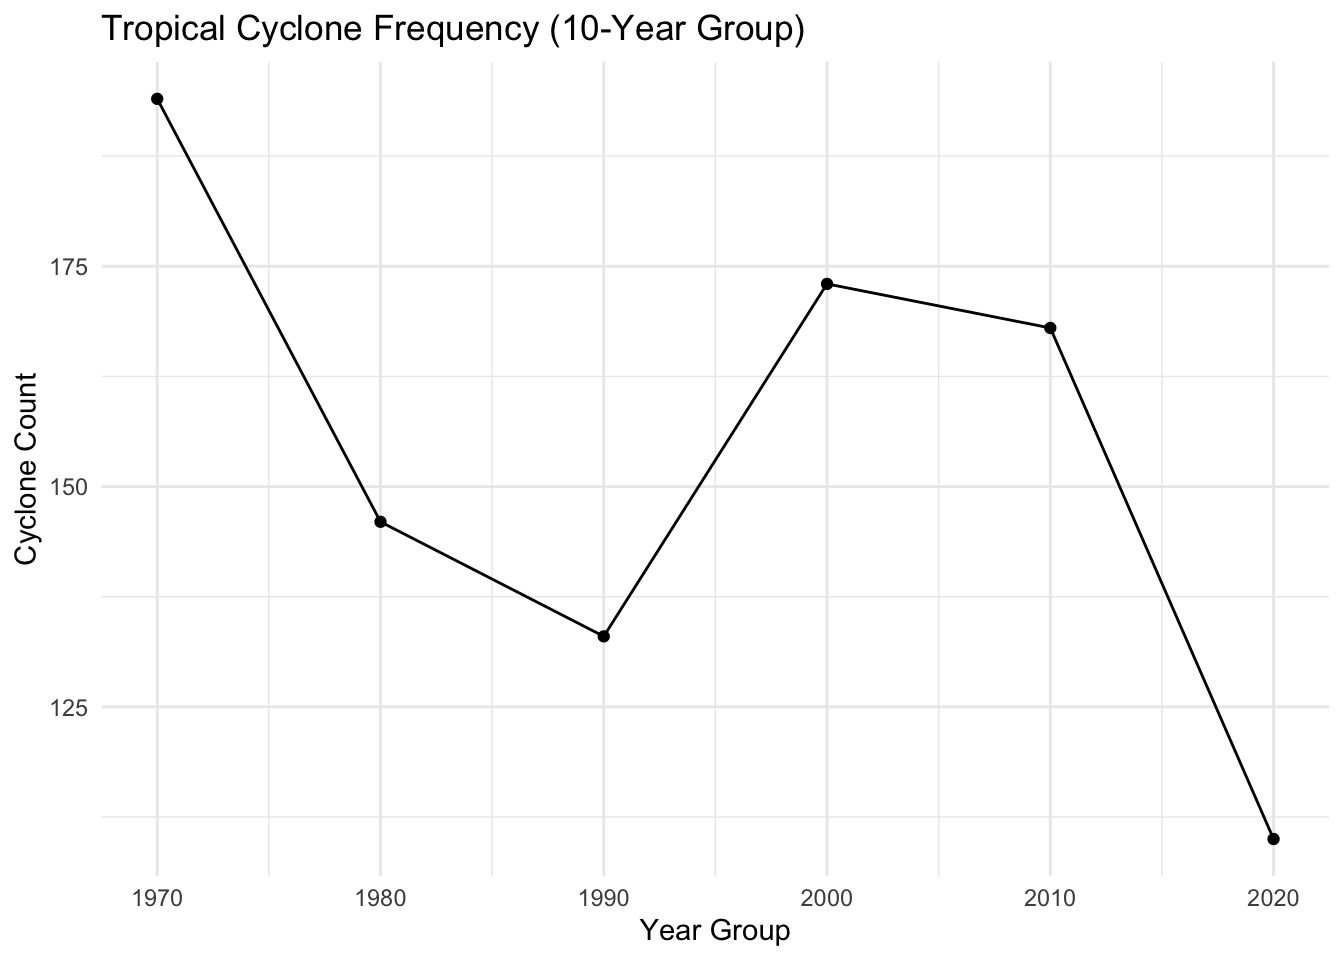
Analysis on the frequency of Hurricanes in the North Atlantic region is performed here. The aim is to observe how frequency changes over the years.
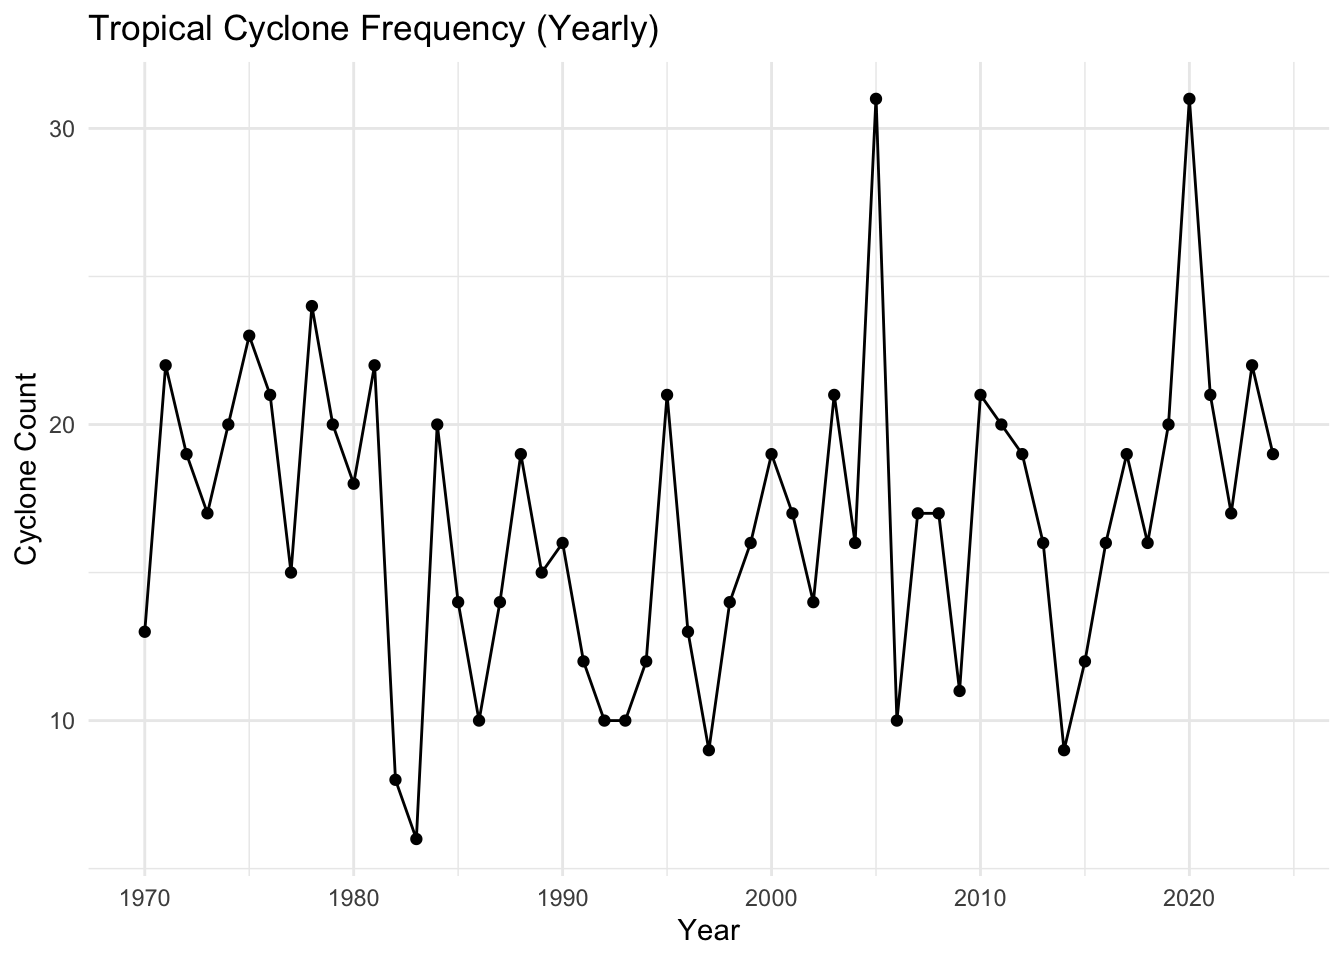
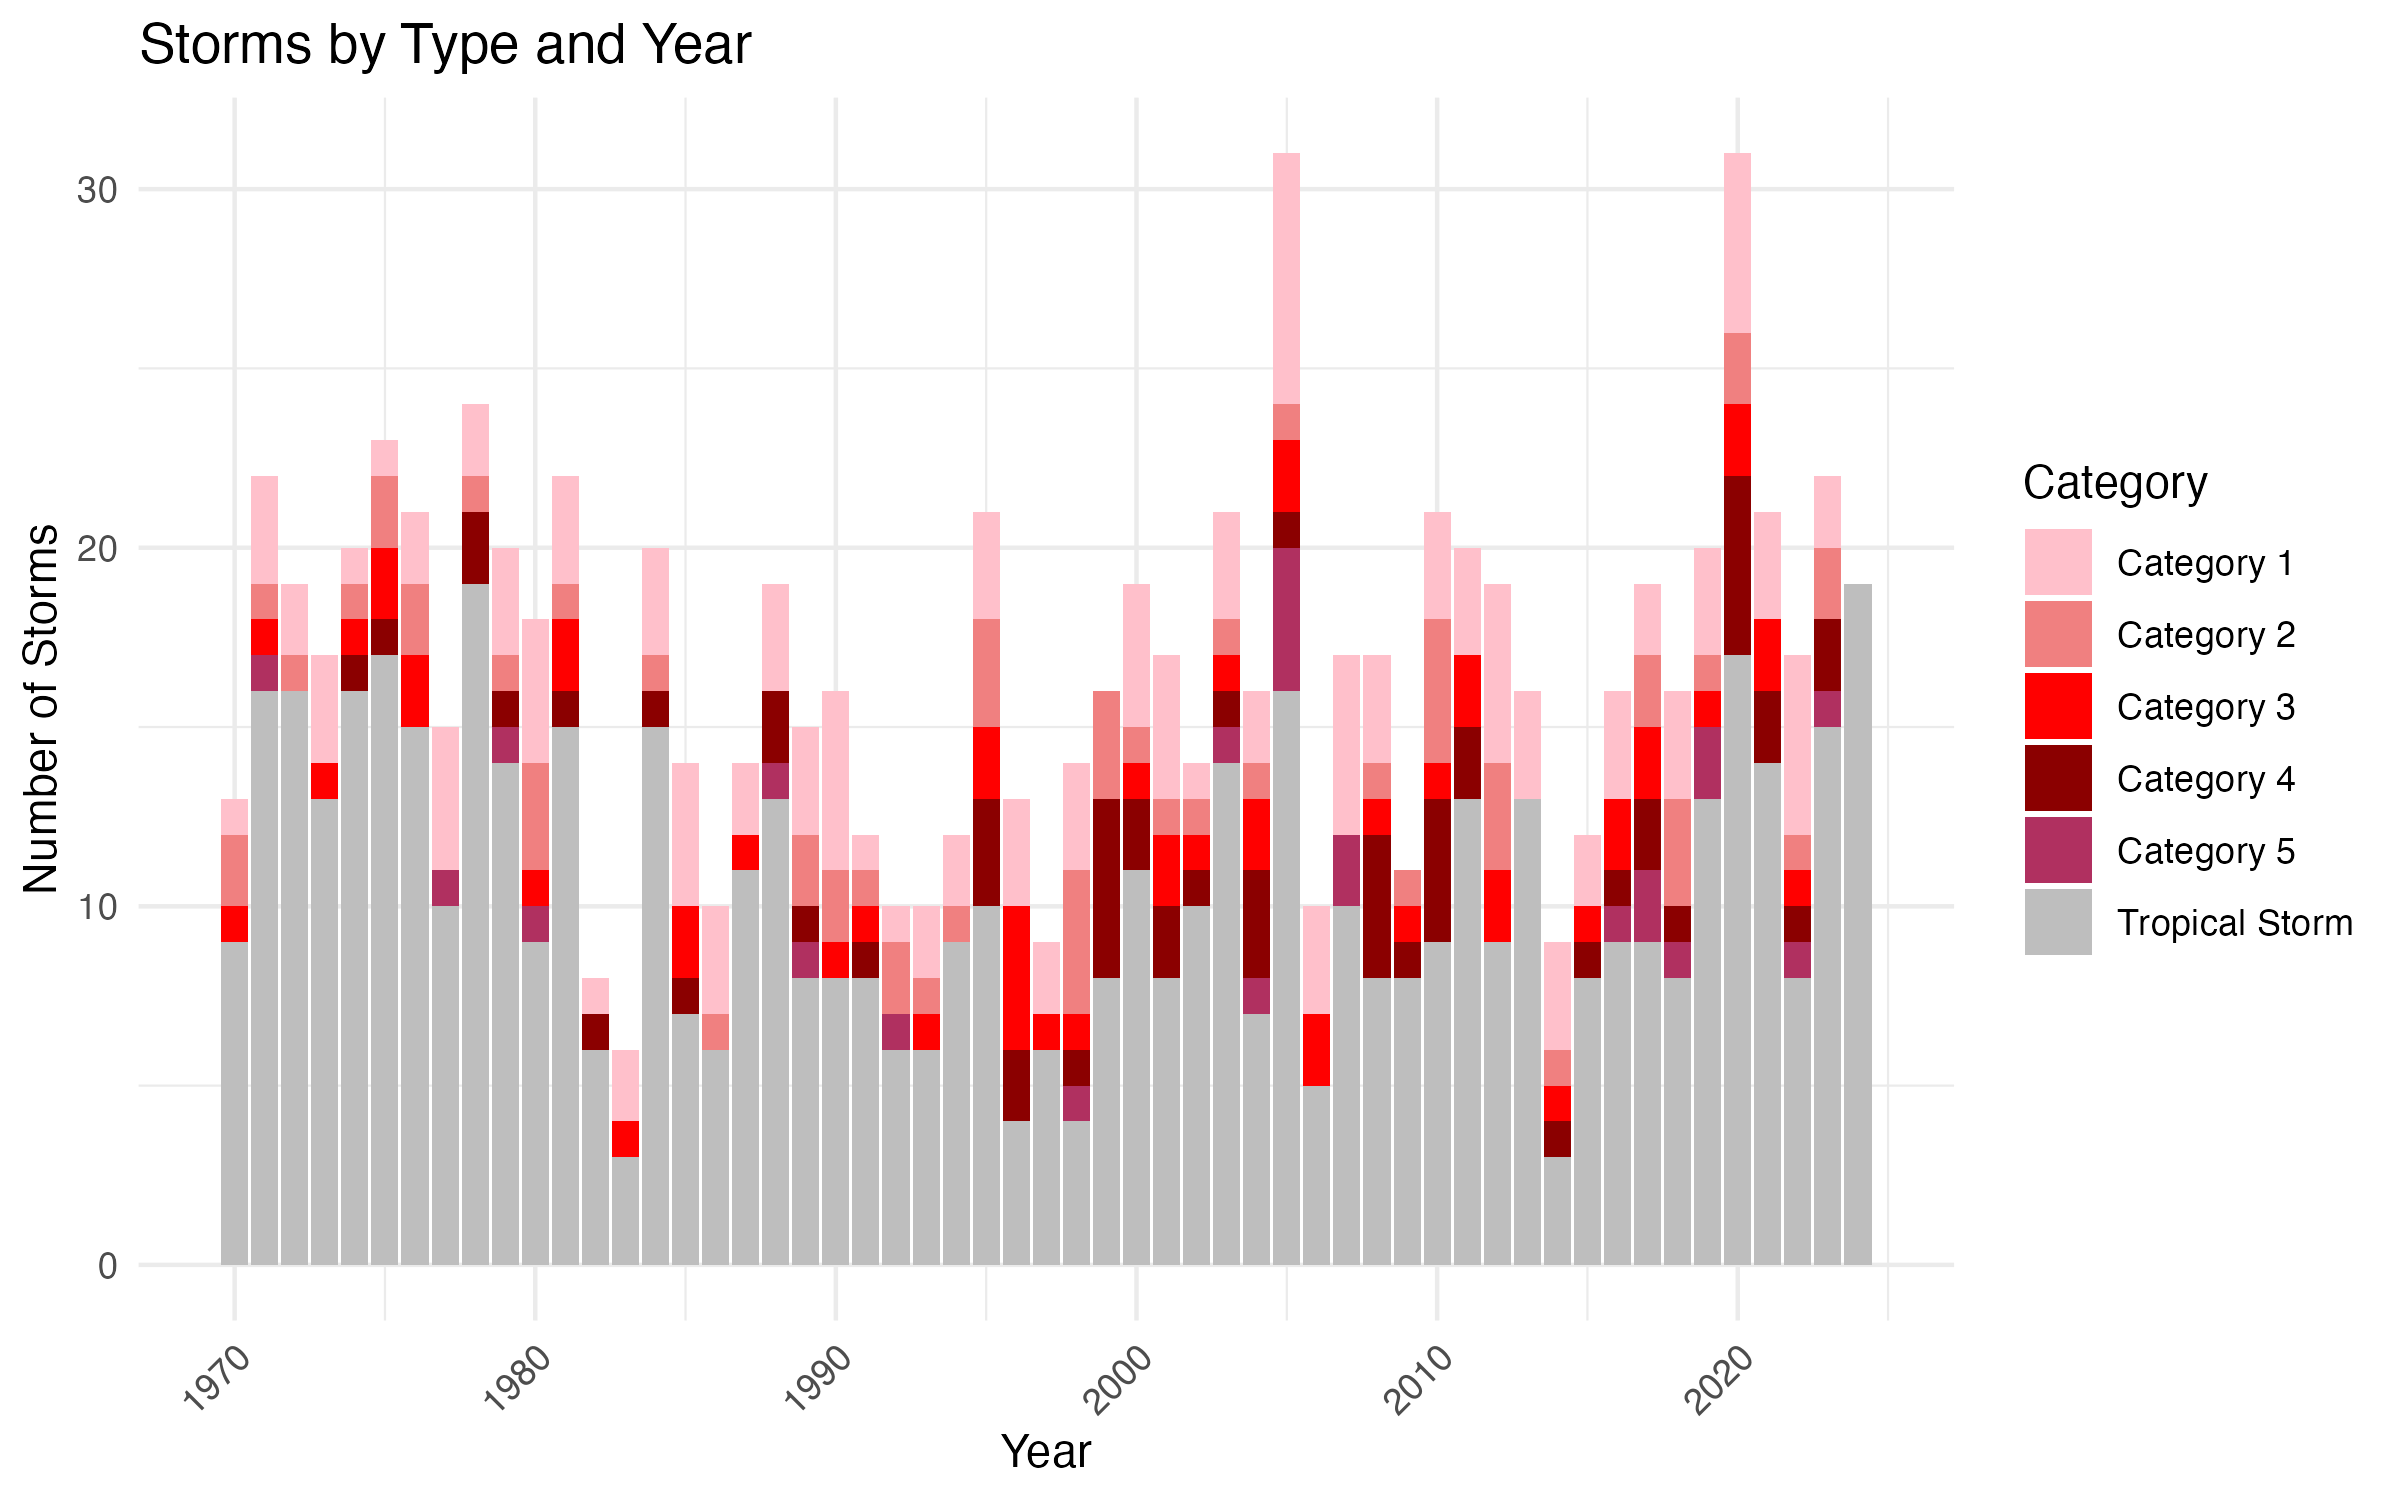
The yearly plot reveals substantial fluctuations from one year to the next. Some years have notably higher cyclone counts (for instance, mid-1990s or around 2005, 2010, and 2020), while others dip significantly. Despite the variability, there is a slight upward tendency from the 1970s through the early 2020s. This does not mean every single year is higher than the last—rather, the long-term average looks to have gradually increased.
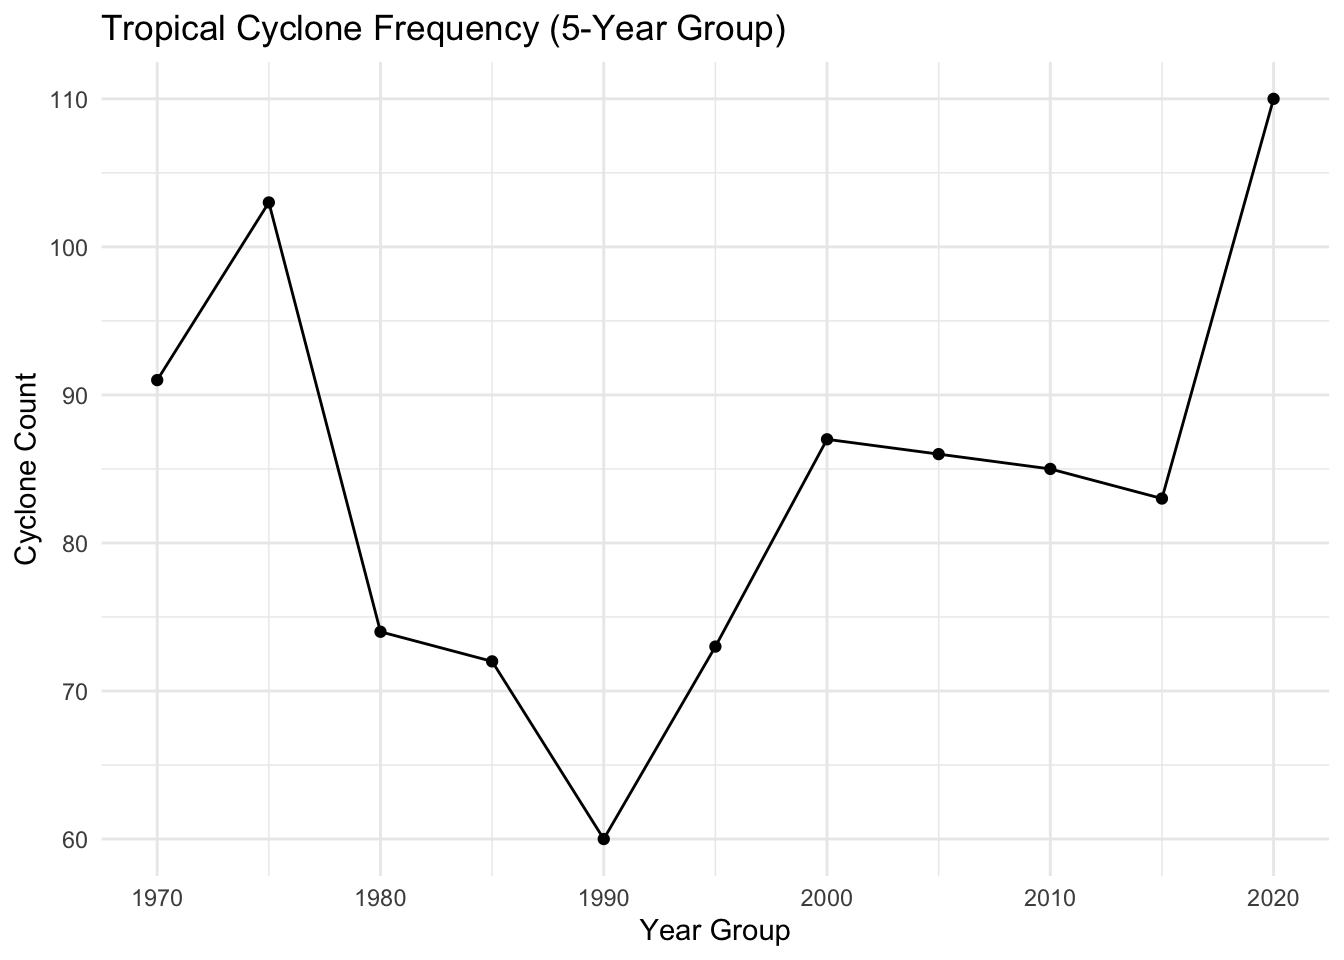
By grouping data in 5-year blocks, the “spikiness” of the yearly data is reduced. The early to mid-1980s exhibit a noticeable dip in total cyclone counts relative to surrounding periods. In contrast, both the 1970s and the most recent 5-year window (post-2020) show higher aggregate storm counts.
Decadal grouping gives the broadest overview of how cyclone numbers evolve over longer time spans. The 1970s had relatively high cumulative counts compared to the 1980s and 1990s. After a low in the 1990s, the 2000s and 2010s show a rebound. The s2020s, even though incomplete, already exhibit an elevated count that surpasses many prior decades.
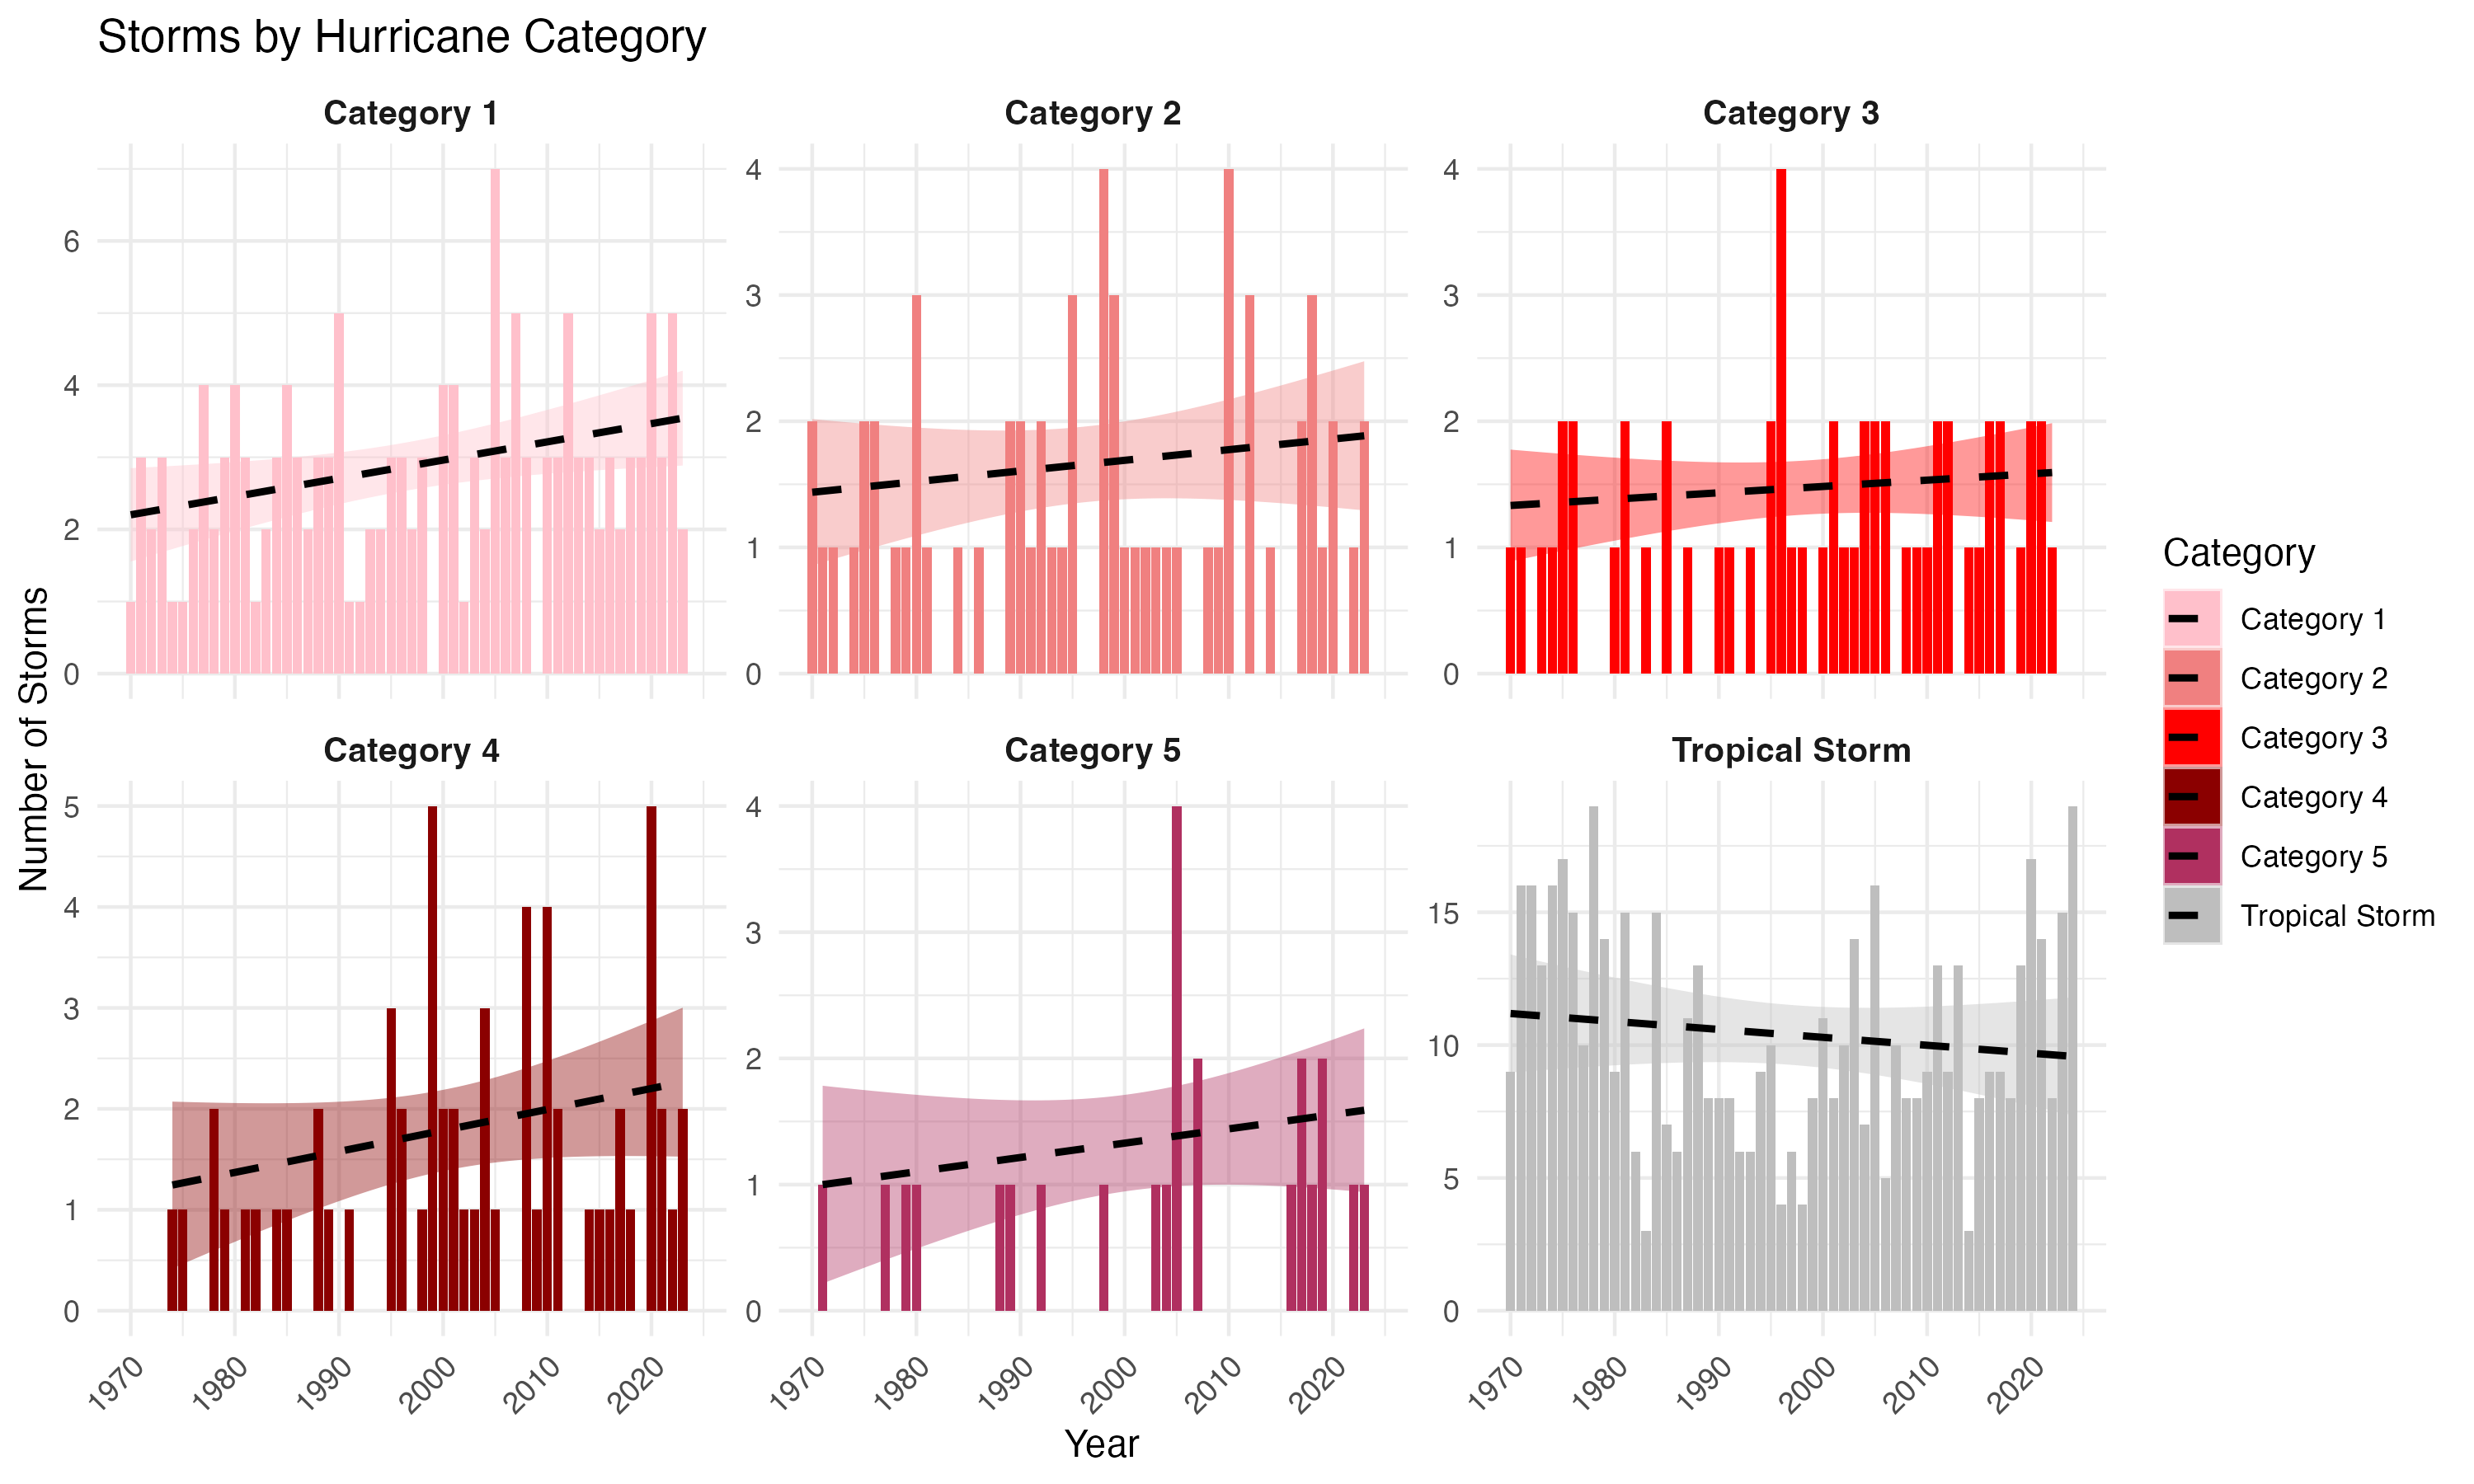
Further analysis observed the frequency per Hurricane category. This includes Tropical Storms, Category 1, Category 2, Category 3, Category 4 and finally Category 5.
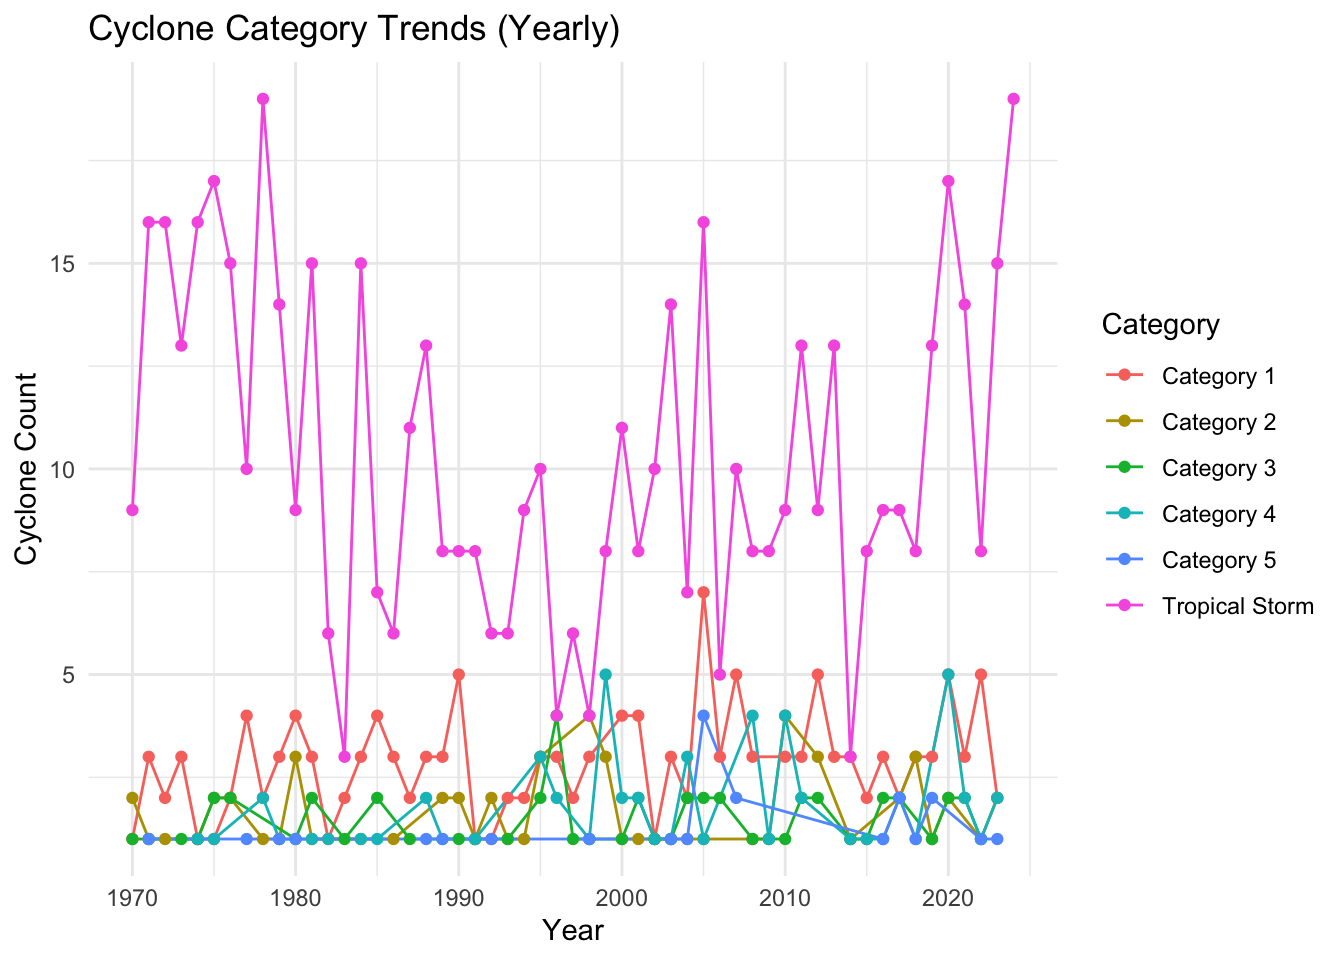
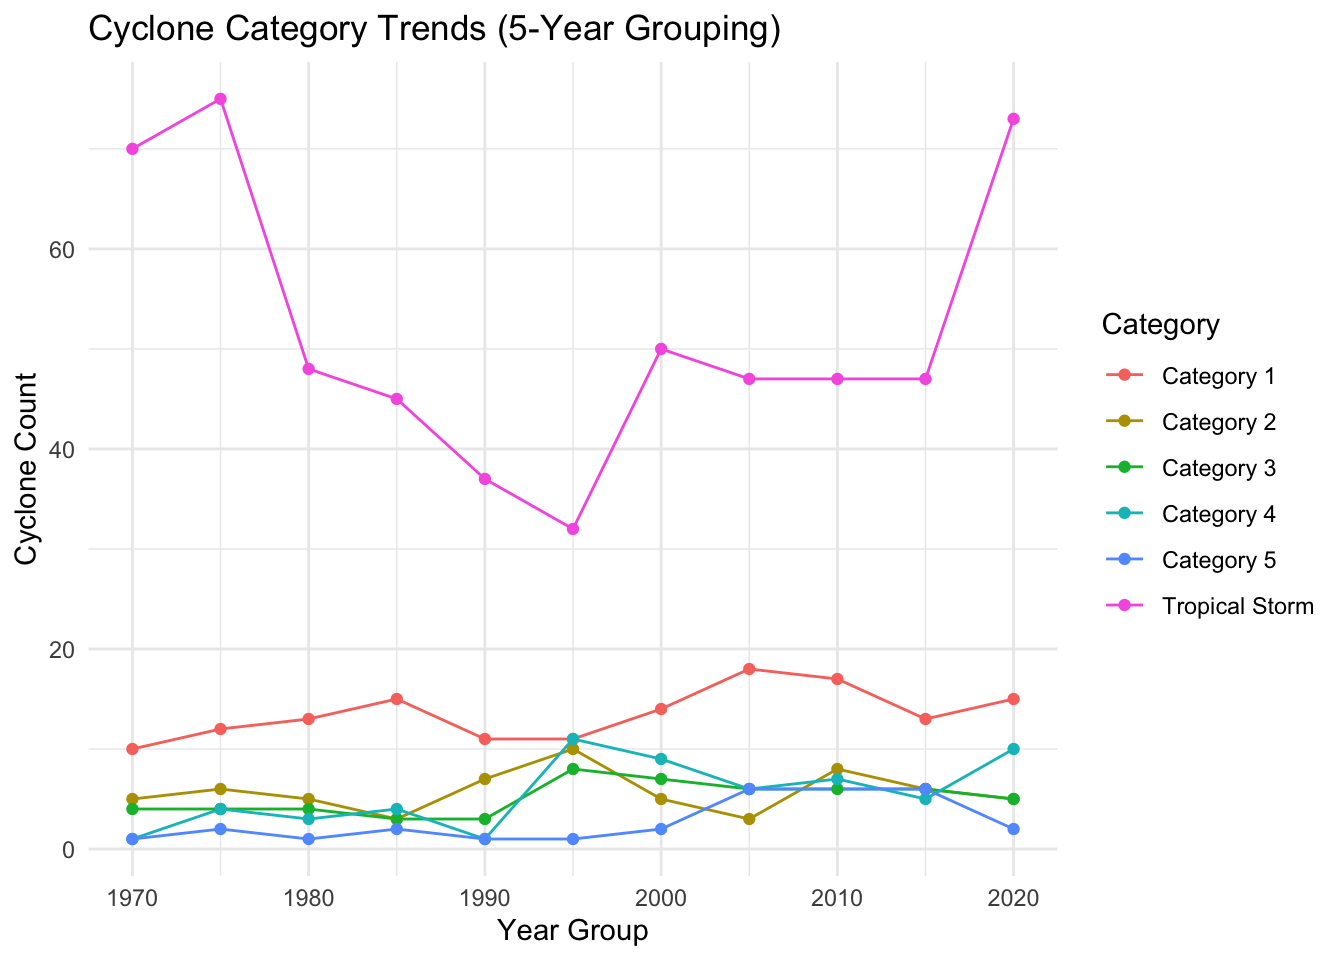
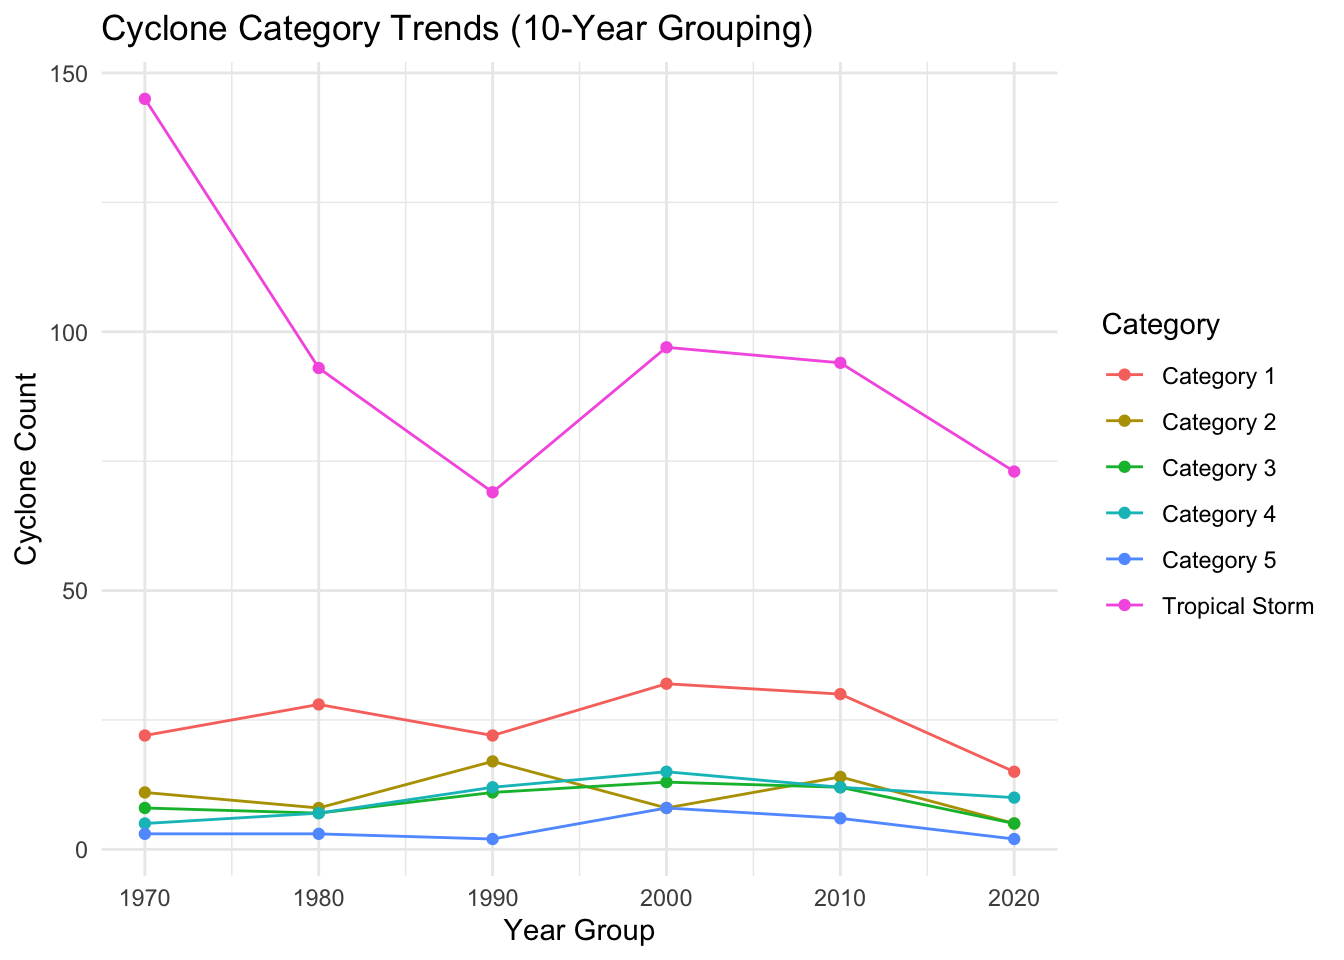
Tropical storms are the most frequent each year, with noticeable fluctuations over time. Category 1 hurricanes show slight increases in certain years, while higher categories appear less common but still vary year to year.
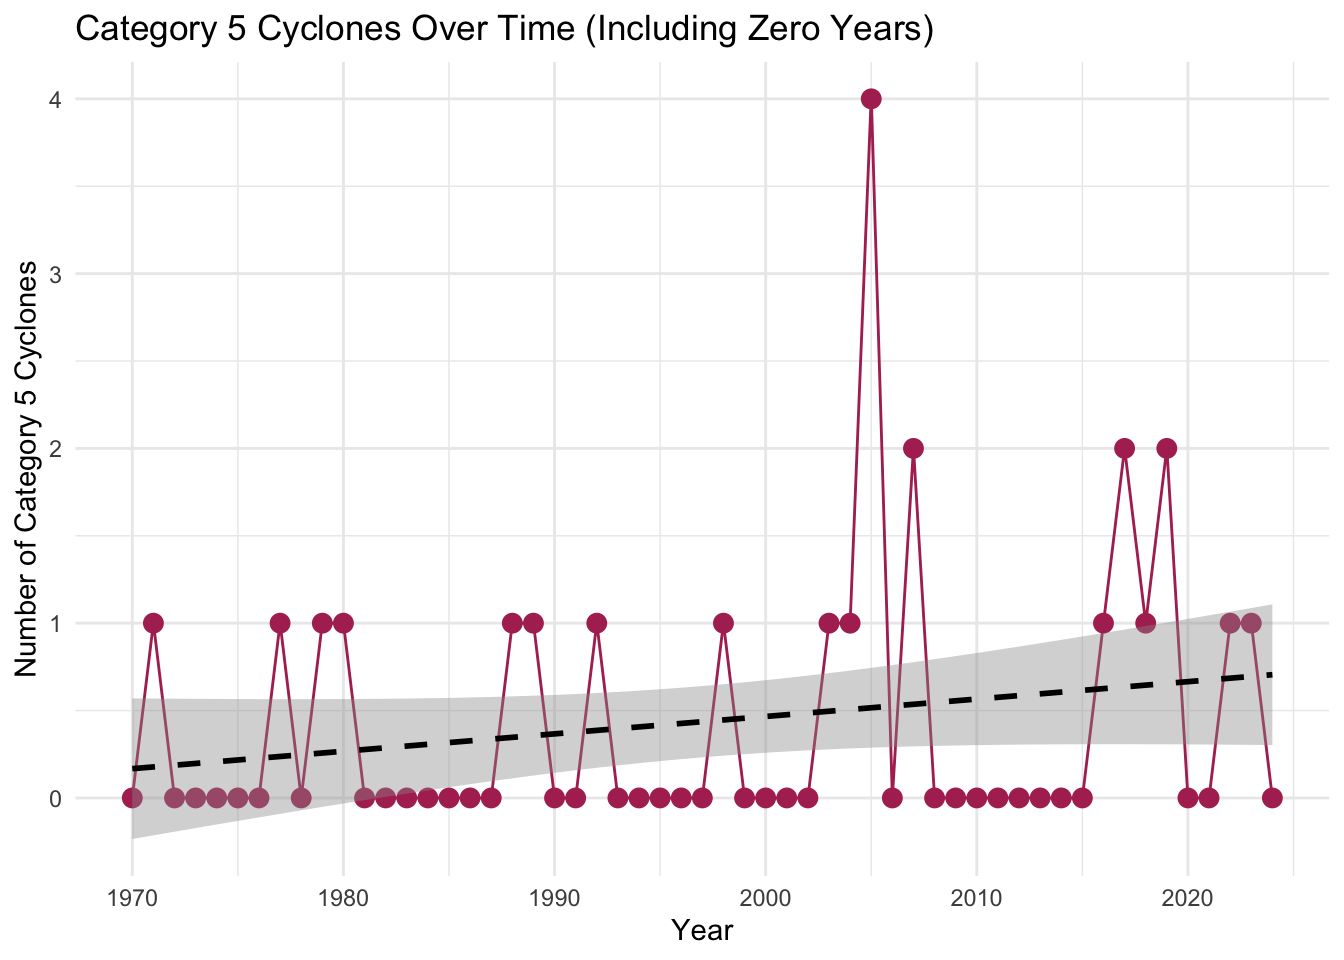
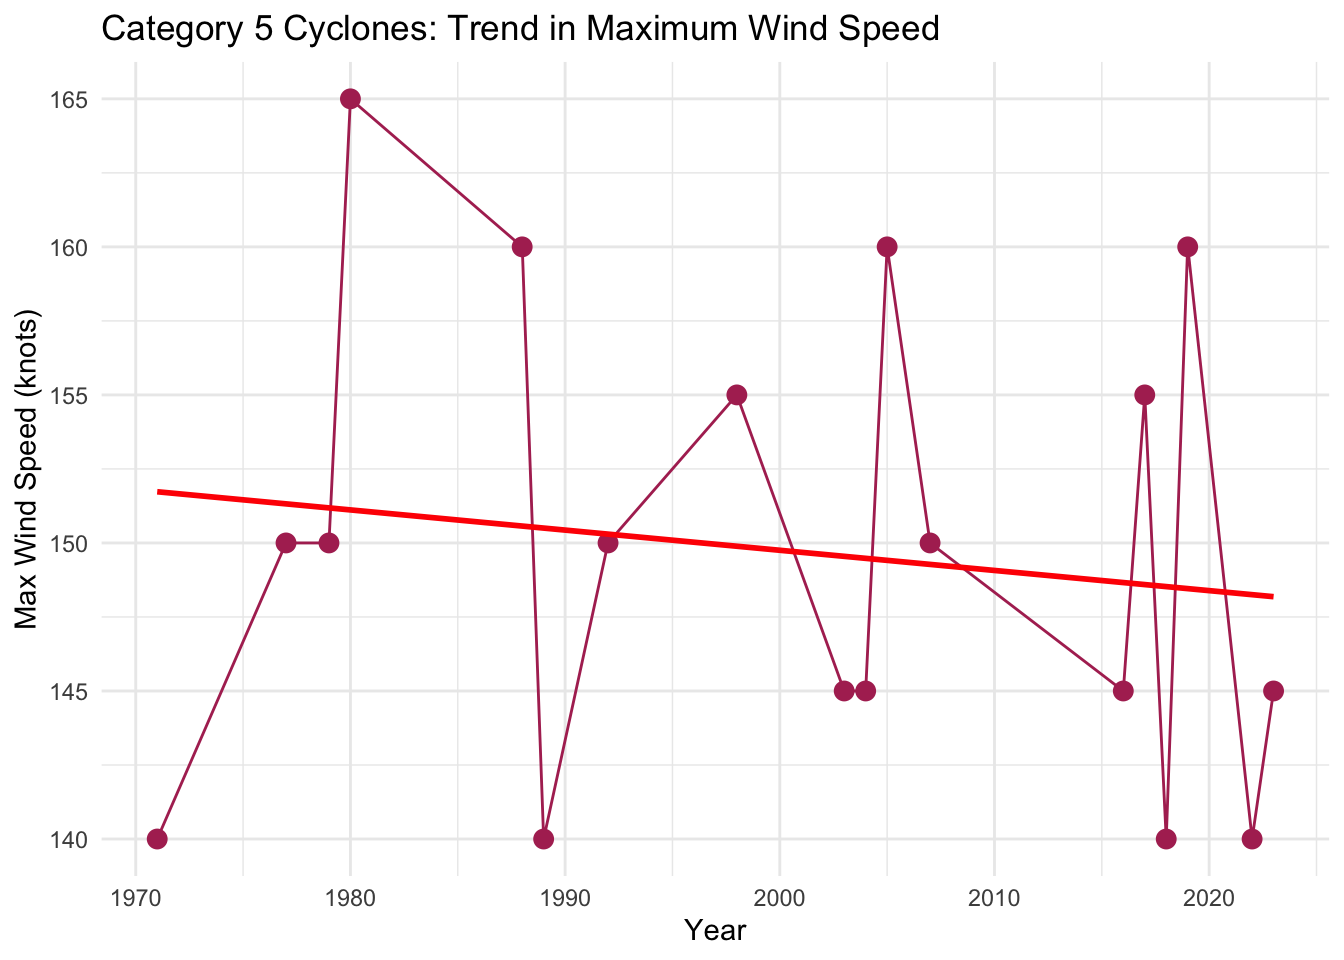
Moreover some closer analysis was performed for Category 5 Hurricanes to observe if they appear more frequently in recent years and if the maximum speed reached is higher in comparison to the past.