About
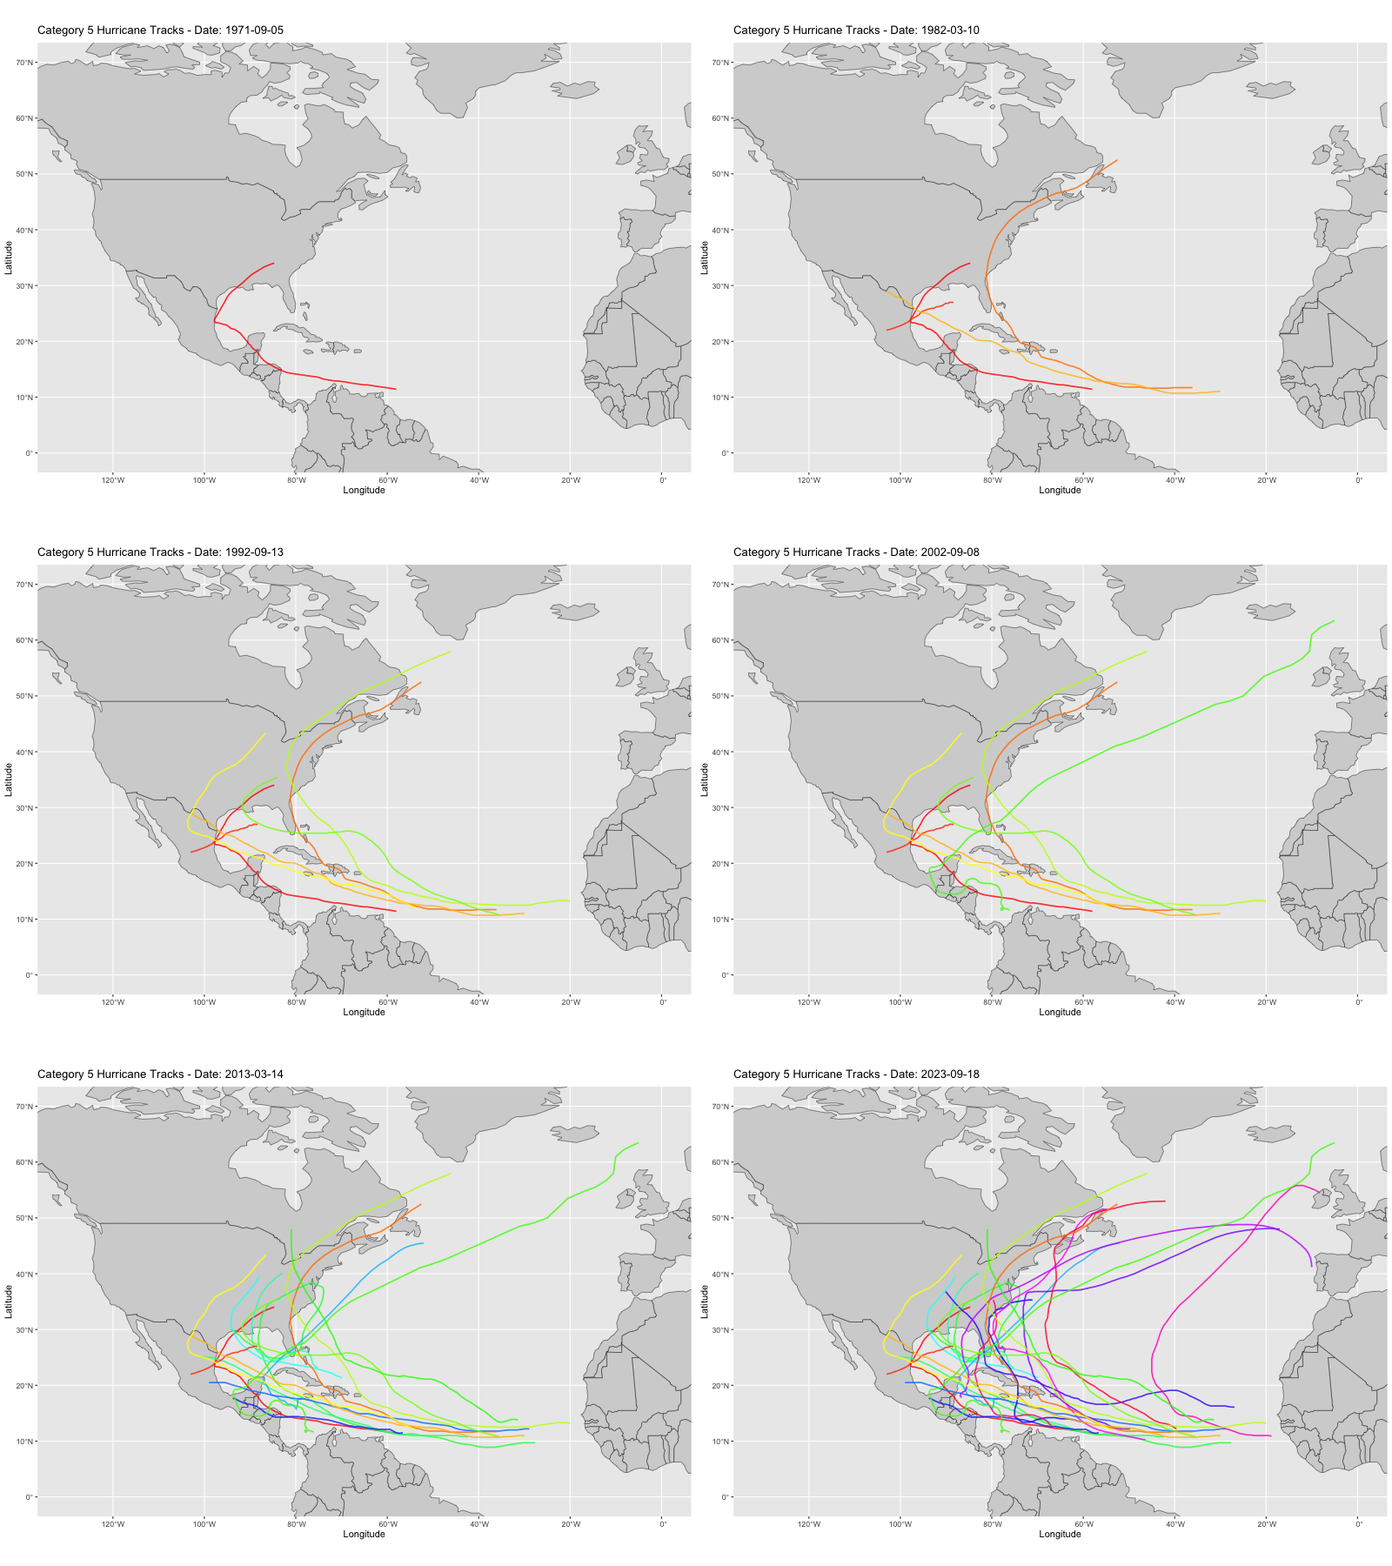
Hurricanes are among the most powerful and destructive natural phenomena, causing widespread devastation across North America. With increasing climate variability, understanding hurricane patterns and their impacts has never been more critical.
This project is dedicated to analyzing hurricane data in the North Atlantic, using advanced data visualization and statistical methods to uncover trends, predict future activity, and assess risks.
Through this platform, we aim to provide insights into:
Hurricane frequency and trends
Map-based visualizations of hurricane paths
Detailed case studies (Closeread)
Interactive Shiny Apps for dynamic exploration of hurricane data
Understanding Hurricanes
Hurricanes, also known as tropical cyclones, are large storm systems that form over warm ocean waters. They are classified based on wind speeds using the Saffir-Simpson Hurricane Wind Scale:
| Category | Wind Speed (mph) | Impact |
|---|---|---|
| Category 1 | 74-95 mph | Minimal damage |
| Category 2 | 96-110 mph | Moderate damage |
| Category 3 | 111-129 mph | Extensive damage (Major Hurricane) |
| Category 4 | 130-156 mph | Severe damage (Major Hurricane) |
| Category 5 | 157+ mph | Catastrophic damage (Major Hurricane) |
Hurricanes bring storm surges, heavy rainfall, flooding, and extreme winds, causing destruction along coastlines and inland areas. Notable hurricanes such as Katrina (2005), Harvey (2017), and Ian (2022) have reshaped cities and communities, highlighting the importance of improved forecasting and disaster preparedness.